

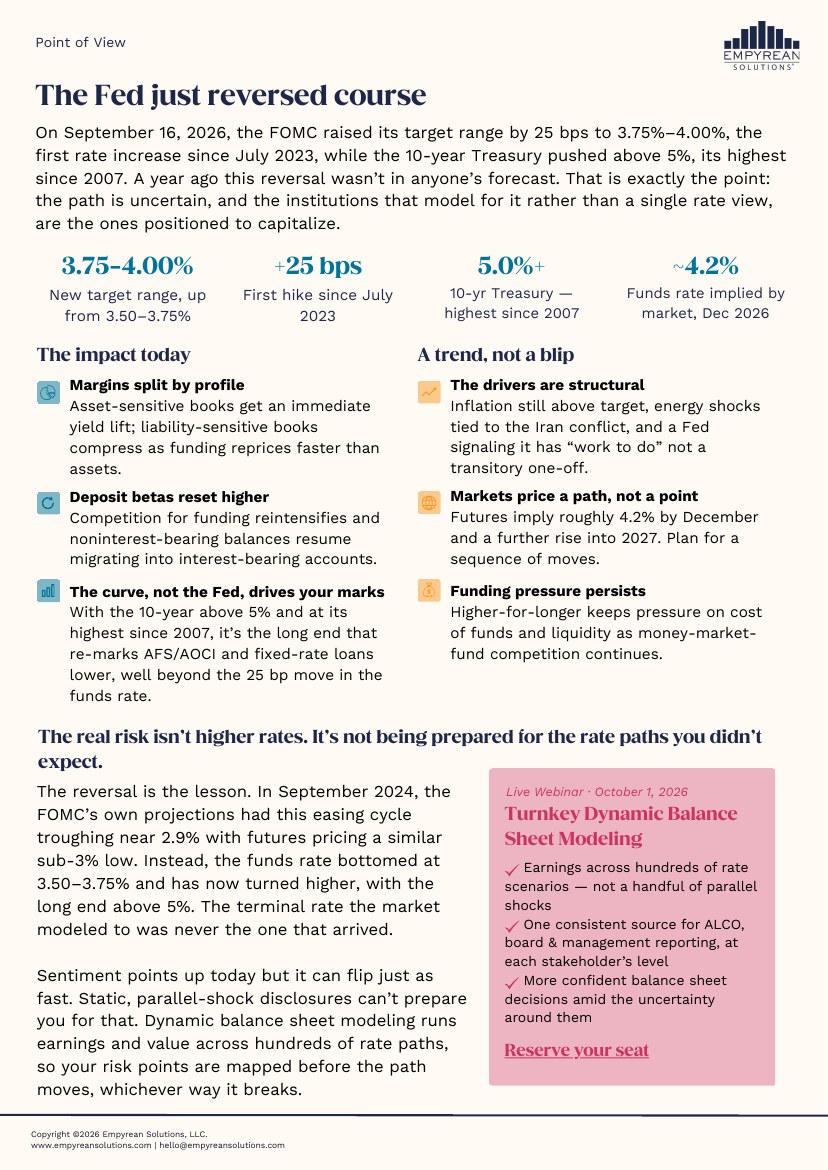
On September 16, 2026, the FOMC raised its target range by 25 basis points to 3.75-4.00%, the first rate increase since July 2023. The 10-year Treasury pushed above 5%, its highest since 2007. A year ago, this reversal was not in anyone’s forecast. That is exactly the point. The path is uncertain, and the institutions that model for it, rather than for a single rate view, are the ones positioned to capitalize.
What changes on your balance sheet today
Margins split by profile. Asset-sensitive books get an immediate yield lift. Liability-sensitive books compress as funding reprices faster than assets.
Deposit betas reset higher. Competition for funding intensifies, and noninterest-bearing balances resume migrating into interest-bearing accounts.
The curve, not the Fed, drives your marks. With the 10-year above 5% and at its highest since 2007, it is the long end that re-marks available-for-sale portfolios, accumulated other comprehensive income, and fixed-rate loans, well beyond the 25 basis point move in the funds rate.
Is this a trend or a blip?
The drivers are structural. Inflation remains above target, energy shocks tied to the Iran conflict persist, and the Fed is signaling it has “work to do.” That is not the language of a transitory one-off.
Markets are pricing a path, not a point. Futures imply roughly 4.2% by December and a further rise into 2027. Plan for a sequence of moves. Higher-for-longer keeps pressure on cost of funds and liquidity as money-market-fund competition continues.
Why the reversal, not the hike, is the lesson
In September 2024, the FOMC’s own projections had this easing cycle troughing near 2.9%, with futures pricing a similar sub-3% low. Instead, the funds rate bottomed at 3.50-3.75% and has now turned higher, with the long end above 5%. The terminal rate the market modeled to was never the one that arrived.
Sentiment points up today. It can flip just as fast.
This is where we will take a position: a static parallel-shock disclosure is not risk management. It is a compliance artifact. It tells you what happens if the curve moves in a way the curve has never actually moved, and it tells you nothing about the path you did not expect.
Deposit behavior is the first thing to move when the Fed surprises, and it is the least frequently tested assumption on the balance sheet.
What is dynamic balance sheet modeling?
Dynamic balance sheet modeling runs earnings and value across hundreds of rate paths, with volume, mix, and behavioral assumptions that move with the path, instead of a handful of parallel shocks applied to a static book. Your risk points get mapped before the path moves, whichever way it breaks.
You already know the question that follows a day like today. Someone at the next asset and liability management committee meeting asks what happens to net interest margin if the long end holds above 5% through 2027, three systems give three answers, and the meeting turns into a debate about whose number is right instead of what to do next.
Join us: Turnkey Dynamic Balance Sheet Modeling
Live webinar, October 1, 2026. We will walk bank and credit union ALM and treasury teams through modeling a surprise rate path before it arrives:
- Earnings across hundreds of rate scenarios, not a handful of parallel shocks
- One consistent source for asset and liability management committee, board, and management reporting, at each stakeholder’s level
- More confident balance sheet decisions amid the uncertainty around them
Key takeaways
- The FOMC raised its target range 25 bps to 3.75-4.00% on September 16, 2026, the first increase since July 2023, with the 10-year above 5%.
- Two years ago, the market and the Fed both modeled a sub-3% trough. The rate that arrived was higher, then reversed. Terminal-rate forecasts are not a planning foundation.
- Dynamic balance sheet modeling across hundreds of rate paths maps your risk points before the path moves.
- Register for Turnkey Dynamic Balance Sheet Modeling, October 1, 2026.
Download the one-page Point of View
Informational only; not investment, legal, tax, or accounting advice. Rate figures reflect market pricing as of September 16, 2026 and are subject to change. Terminal-rate reference: FOMC Summary of Economic Projections, September 18, 2024.