A cornerstone for financial institution decision making
As your organization looks to make strategic and tactical decisions, do you trust your intuition, your sixth sense, your gut feel, or do you trust your reports, your data, and your analytics? Does your institution still make decisions purely based on the knowledge and experience of certain individuals, based purely on data and key metrics, or based on a combination of the two? Given the current banking environment, the uncertainties regarding the economic, political and health climates, and the continuous evolution of your customers’ expectations regarding the types, availability, and timeliness of their interactions with your institution, you cannot afford to be in one camp or the other. In today’s environment you need to gather, capture, and calculate key pieces of data, information, and metrics, and then layer your people’s knowledge, experience, and intuition to support an efficient, yet effective decision-making process. Leveraging both data and intuition to drive decisions is referred to as informed decision making and is at the heart of creating a profitability driven culture within any financial institution.
The banking industry has seen a significant push toward data-based decision making over the past five, ten, and even twenty years. The proponents of this approach typically point to advancements in technology, to increased accessed to better quality data, and to the advent of artificial intelligence as the driving force behind this movement. While the capability to better access, leverage and utilize data in the decision-making process is an important factor, it is not the true impetus behind this evolution. Rather, it is the volatility, uncertainty, and pace of change with respect to the regulatory and political environment, the numerous impacts related to the Covid-19 pandemic, the migration from traditional brick and mortar to digital and virtual customer experiences that is tipping the scales toward the use of more empirical data in the decision-making process. For example, in a recent FMS poll, 73% of respondents indicated that they are using profitability results and data more than ever to help inform and drive decisions.
To support this progression to a more data informed decision-making process, and to make any related value-added data initiatives successful, including profitability analysis, financial institutions need to create a culture that encourages and promotes the use of data and metrics to improve decision making. From a profitability perspective, there are several key factors needed to create this “Profitability Driven Culture”. These include:
- Beginning with the End in Mind
- Ensuring that the profitability measurement and analysis process is defensible
- Evaluating profitability results as a relative metric, as opposed to an absolute metric
Begin With the End in Mind
In his popular book, 7 habits of Highly Effective People, educator, businessman, motivational speaker and author, Stephen Covey, identifies the second habit as “Begin With the End in Mind.” The essence of this habit, and this phrase, is that you need to know where you are going, what you are building, what your goal is, before you start the journey. You cannot just show up at a home site with lumber, concrete mix, drywall, piping, conduit, nails, screws, etc. and just start building a house. You need to first design the house, then have an engineer create the blueprints and schematics, then order the materials, and then start building the house to meet the design.
The same holds true with the profitability process. Before you start identifying what data and calculations are needed to measure profitability, you need to identify what types of questions your organization is trying to answer, what business problems can be solved and what strategic and tactical decisions can be made with the support of profitability results and information…these will define the “End in Mind” for your institution. Once you have defined your end in mind, you can then work backwards to eventually identify what calculations and data are needed to support those goals, as indicated in figure 1.
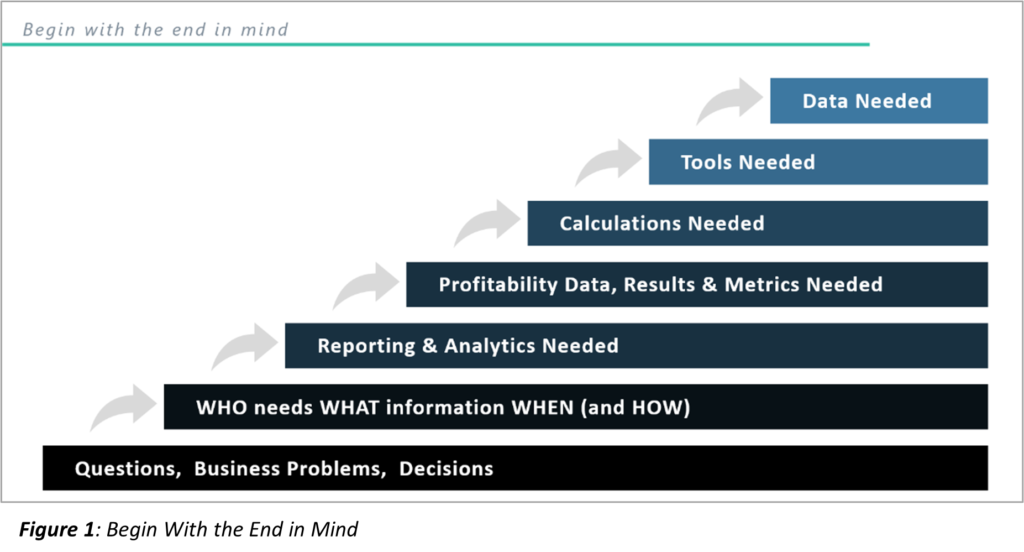
Many past profitability initiatives started with the data, the calculations, and the tools, just generating a set of profitability results, and then the institutions tried to figure out what to do with the data and results. However, without the “North Star” of the end in mind (the questions, business problems and decisions) to drive the rules, calculations, and data, many of these past initiatives were unsuccessful.
The Profitability Measurement Process must be Defensible
Profitability measurement is as much art as it is science. Opinions regarding the “correct” way to measure and calculate profitability vary widely based on past experiences, knowledge, which segments of profitability are being calculated, availability of data, etc. The political and cultural dynamics are as challenging as the data and tool aspects.
To create a profitability driven culture, where profitability data and results are truly used to help answer questions and make decisions, it is imperative that people trust the results. While everyone may not agree upon the exact rules and approaches your institution chooses, it is critical that the measurement and calculation process is defensible. Within the constructs of the profitability process, defensible simply means consistent, accurate, and transparent.
Consistency
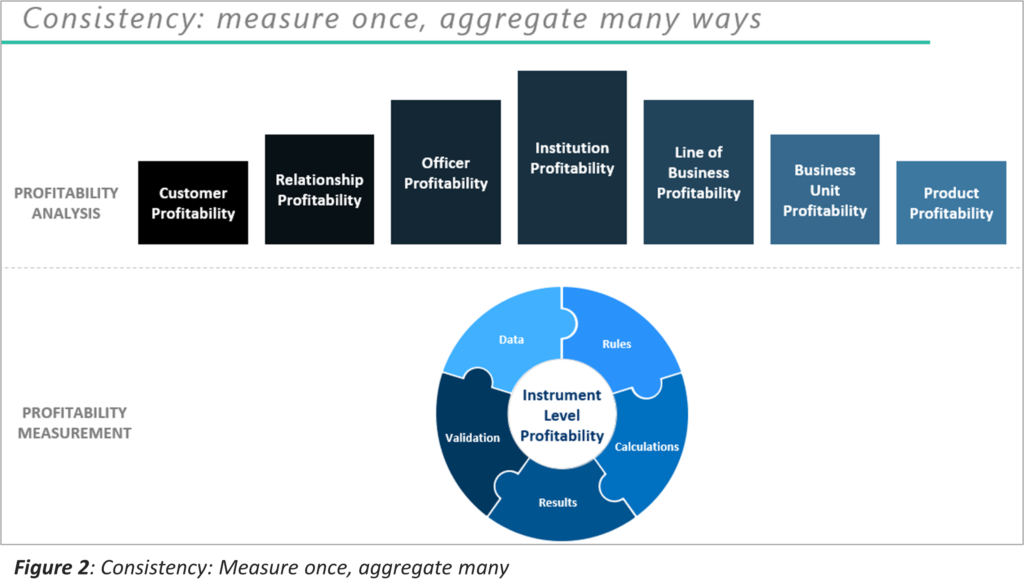
The only way to ensure consistency of profitability results across all segments of the organization, is to measure once, at the lowest level, and then aggregate results from the lowest level to each segment needed. Instead of having a separate data, calculation and measurement process for channel profitability, branch profitability, product profitability, customer profitability, etc., which will inherently lead to inconsistent results, financial institutions should have one data, calculation, and measurement process at the individual instrument level. Once the profitability has been calculated for a single instrument, the results can easily be aggregated by customer, relationship, officer, product, line of business, branch, channel, etc. as indicated in Figure 2.
Accuracy
The term accuracy as it relates to profitability measurement can be a bit of a misnomer, as the process requires the allocation of some components of profitability to the instrument level, necessitating subjective decisions regarding the allocation method. However, there are specific best practices in the measurement process that can improve the accuracy of profitability framework, and as such, making the calculations more defensible.
The first of which is ensuring that all five components of profitability are accounted for in the profitability equation, and then using the best practice approach for each of these components:
- Net Interest Margin: leverage matched-term funds transfer pricing that accounts for each instrument’s term, cash flow and behavioral characteristics in the calculation of the transfer credit/charge and related net interest margin at the instrument level.
- Non-interest income: ideally capture fee and other non-interest related income at the individual transaction level, which can then simply be applied to each instrument. If these data sources are not available, use a logical driver to allocate those non-interest income accounts to the instrument level.
- Non-interest expense: the costing process often proves to be the most challenging part of the profitability equation. Any direct expenses should be captured at the transaction/instrument level. For other expenses, the costing process should be as detailed as required (weighing the value added of a more detailed process vs. the cost of setting up and maintaining that process). Each institution needs to decide what approach is appropriate, whether it be activity-based costing (ABC), rule-based cost attribution, or survey-based attribution. Whichever approach is used, it must be logical, explainable, maintainable, and defensible.
- Provision for loan loss: if performing CECL calculations, ideally the provision amount for each instrument can be captured as part of that framework. If not, a probability of default-based credit risk model should be utilized.
- Capital: The ability to account for capital in the profitability equation is critical in today’s environment. This enables the calculation of risk adjusted return on capital, which is the best comparative profitability metric available. There are several approaches that can be used to attribute capital to the instrument level:
- Product Based: assigning a capital percentage to each instrument based on the product type of each instrument.
- RAROC Matrix: creating a RAROC matrix, where a capital percentage or rating is applied to each product, and for each risk category (i.e. credit risk, market risk, operational risk).
- PD/LGD Based: utilizing a detailed probability of default (PD), loss given default (LGD) and time-based approach for assigning capital due to credit risk, while still assigning a capital percentage or rating for the market and operational risk categories (see figure 3).
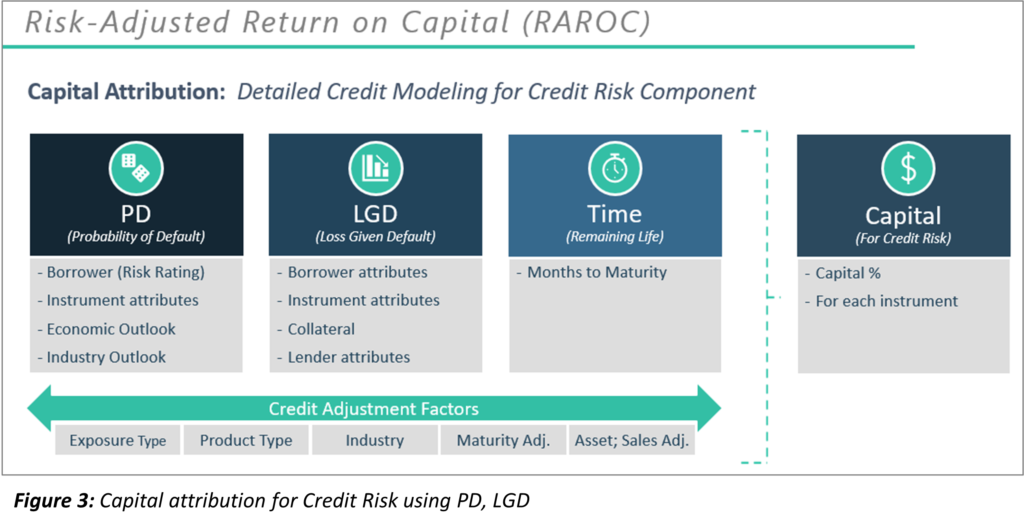
Given the current market and economic environment, and resulting uncertainty related to future credit quality, it is critical to utilize the approach that accounts for the risk of each instrument, and the borrower of that instrument. This PD/LGD/Time based approach best supports a more accurate picture of profitability on a comparative basis, as it accounts for the size of the exposure, the type of the exposure, the collateral of the exposure and the risk of the borrower. All important factors when assessing and comparing historical profitability, but even more so when using projected profitability as part of pricing and credit decisioning.
Transparency
The final factor to help ensure a defensible profitability measurement framework, is to provide transparency throughout the process and organization. You do not want to be perceived as the “wizard behind the curtain”, like in the Wizard of OZ. Several best practices can help prevent this, including:
- Establish and use aProfitability Steering Committee. This cross functional team can help:
- Identify uses of information (what questions to answer, what business problems to solve and what decisions to make with the profitability results)
- Provide input into profitability and allocation rules that make the most sense for their specific functional areas
- Act as a sounding board for ideas and approaches
- Achieve buy-in and trust in the process and results within their teams once you roll the results out to the organization
- Utilize logical, data driven rules and approaches. This includes instrument level data for matched-term transfer pricing and provision calculations, transaction data for expenses and income, and the use of logical drivers in the attribution rules where detailed data is not available (e.g., cost and capital allocations).
- Keep it simple. This is especially true if you are just starting out with a new profitability initiative. You need to be able to explain how results are calculated to people that do not understand profitability analysis.
- Provide training. Train all people across the organization that you expect to use the results and information, including the what’s, the how’s and most importantly the why’s of the process.
- Allow access to the details. Enable reporting down to the instrument, transaction, and individual profitability component levels. Enable the people that want to understand the details to access the details when they have questions.
Profitability as a Relative Metric
When analyzing profitability results, whether it be for a customer, officer, product, branch, or any other segment, viewing a single period profit and loss (P&L) statement in terms of dollars provides limited value. Yes, you can determine if that one product, for example, is adding or eroding value for the organization, and which of the five profitability components is driving the profit or loss for that one period, but that is about it. A single period P&L, for a single segment of the institution adds almost no value as a decision-making tool.
The true value in profitability analysis is realized by examining the results as a comparative metric. Whether it be comparing profitability results across time, or comparing products, customers or officers against each other, comparative analysis enables the organization to view profitability from several perspectives that will assist in both strategic and tactical decisions. Examples of these perspectives include:
- Trend analysis: whether based on historical or projected profitability, trend analysis provides insights into positive or negative gains in profitability over time, and if viewed at a detailed level, to understand which of the five components of profitability is driving those changes. Is profitability increasing or decreasing? Are margins expanding or compressing? Is fee income increasing or deteriorating? These types of insights are extremely valuable in shaping business decisions over time.
- Ranking or stack ranking: enables the organization to determine which customers, products, etc. within a segment are most and least profitability. These comparisons allow people across the organization to determine which products, customers, relationships, etc. to focus on, and in some cases which should abandoned.
- Composition analysis: provides insights into how much each item is contributing to the entire segment, or even to the entire institution, on a percentage basis. As the organization analyzes different focal points, plans and strategies, it is critical to understand where the majority of profitability is being generated, whether that be a particular product, region, line of business, or relationship.
All these types of comparative analysis can be used to help drive product and marketing strategies, operational changes, channel strategies, pricing strategies and decisions, etc.
In addition, viewing a single period P&L, for a single segment naturally focuses attention on the details of the P&L, on the five components of profitability, and ultimately how each was calculated. But if you establish a baseline (again that is logical and defensible), and then analyze profitability on a relative basis going forward, it removes the focus from the details of the calculations and places it on the relative comparisons, and changes over time. It takes the focus away from the rules and places it on the results.
As you consider the concept of profitability as a relative metric, it is important to think about which profitability metric(s) is best suited for relative analysis. Analyzing profitability on a pure dollar basis is good, but it does not account for the size (balance) of the portfolio, nor the risk that is generating the profits. Return on Assets (ROA) is better for relative profitability analysis, as ROA accounts for the size of the portfolio, however it still does not account for the inherent risk of the portfolio. Risk Adjusted Return on Capital (RAROC) is the best relative profitability metric as it accounts for both the size of the portfolio and for the intrinsic risks of the instrument(s) and borrower(s) through the capital allocation process.
Conclusion
Unprecedented market changes, volatility, and uncertainty due to a variety of factors are forcing financial institutions to incorporate more empirical data and financial metrics into the decision-making process. Including profitability data and results is essential, as this information enables both strategic and tactical decisions that are aligned with the performance goals of the organization. The objective should be to create a profitability driven culture, where people throughout the organization understand, trust, and utilize the profitability data to help answer key questions, solve business problems, and make more informed decisions.
Want to learn more?
Stay connected with Empyrean’s latest insights and solutions
Join our community of financial institutions and get access to live webinars, comprehensive guides, best practices, and industry insights that will transform your institution’s risk and planning management processes.